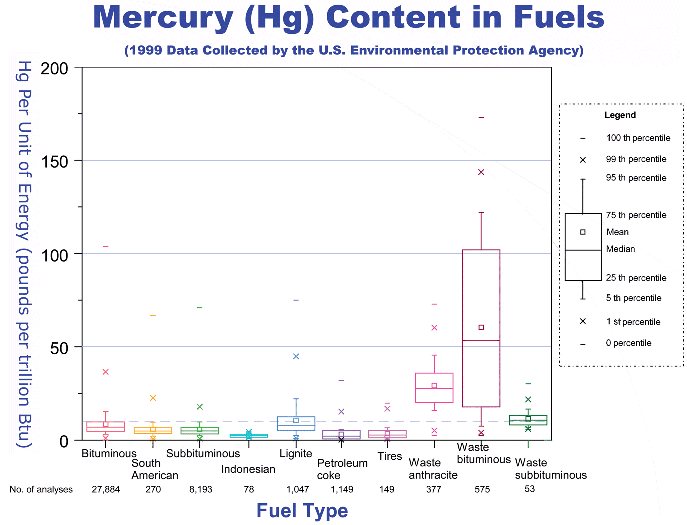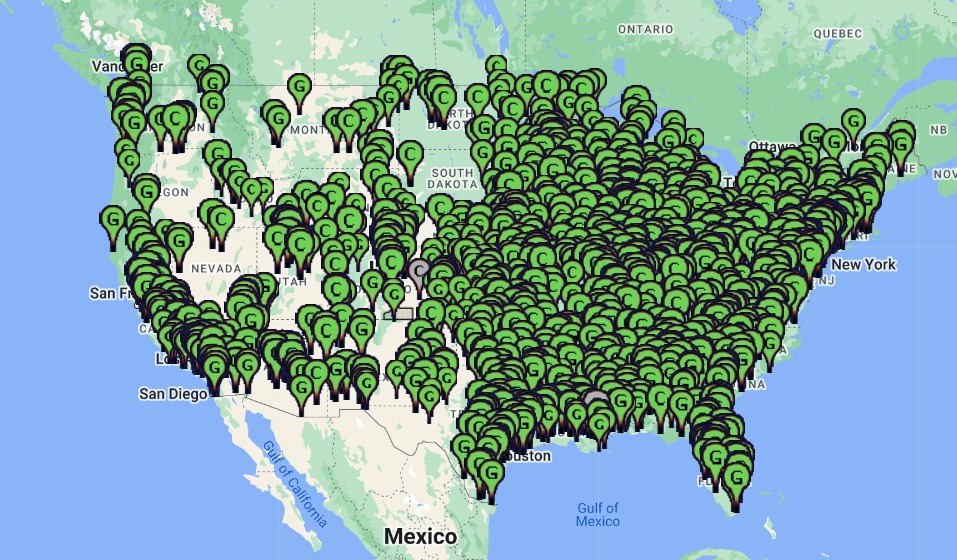
Above chart from “Mercury and Utilities: Current
Control Technologies” (7/31/2001 EPA presentation, page 6), based on EPA’s 1999 Information Collection Request (ICR) (download raw data or view their summary data in Excel. More concise summary data comparing BTU, mercury and sulfur content of coals by region available from the U.S. Department of Energy’s Energy Information Administration, Assumptions to the Annual Energy Outlook 2004, p124.Data for the tables on the waste coal page (compiled from the raw ICR data) is below:
| Coal Type (State) | # Samples | Sulfur (%) |
BTU/lb | Mercury (ppm) |
Chlorine (ppm) |
Number times more mercury to produce same amount of power |
|---|---|---|---|---|---|---|
| Coal (Anthracite and Bituminous) | 102677 | 1.68 | 13,196.82 | 0.11 | 1,040.59 | |
| Waste Coal (Anthracite and Bituminous) | 4017 | 1.64 | 7,931.73 | 0.36 | 601.18 | |
| Ratio (Waste Coal / Normal Coal) | 0.98 | 0.60 | 3.11 | 0.58 | 5.2 | |
| Anthracite (PA) | 293 | 0.64 | 10,796.04 | 0.16 | 405.25 | |
| Waste Anthracite (PA) | 993 | 0.51 | 6,733.59 | 0.19 | 236.78 | |
| Ratio (Waste Coal / Normal Coal) | 0.80 | 0.62 | 1.19 | 0.58 | 1.9 | |
| Bituminous (all) | 102375 | 1.69 | 13,206.42 | 0.11 | 1,043.39 | |
| Waste Bituminous (all) | 3011 | 2.39 | 8,751.96 | 0.46 | 844.06 | |
| Ratio (Waste Coal / Normal Coal) | 1.42 | 0.66 | 4.08 | 0.81 | 6.2 | |
| Bituminous (KY) | 20836 | 1.44 | 13,216.14 | 0.09 | 1,086.09 | |
| Waste Bituminous (KY) | 527 | 1.90 | 12,672.86 | 0.10 | 745.46 | |
| Ratio (Waste Coal / Normal Coal) | 1.32 | 0.96 | 1.07 | 0.69 | 1.1 | |
| Bituminous (IL) | 6776 | 2.45 | 13,077.90 | 0.08 | 2,035.59 | |
| Waste Bituminous (IL) | 94 | 2.44 | 10,433.61 | 0.08 | 1,109.75 | |
| Ratio (Waste Coal / Normal Coal) | 1.00 | 0.80 | 0.95 | 0.55 | 1.2 | |
| Bituminous (MD) | 494 | 1.64 | 13,187.43 | 0.18 | 686.45 | |
| Waste Bituminous (MD) | 143 | 3.89 | 10,592.63 | 0.34 | 752.82 | |
| Ratio (Waste Coal / Normal Coal) | 2.38 | 0.80 | 1.90 | 1.10 | 2.4 | |
| Bituminous (UT) | 2411 | 0.55 | 12,759.20 | 0.05 | 212.64 | |
| Waste Bituminous (UT) | 37 | 1.18 | 6,347.45 | 0.12 | 236.91 | |
| Ratio (Waste Coal / Normal Coal) | 2.16 | 0.50 | 2.18 | 1.11 | 4.4 | |
| Bituminous (PA) | 13468 | 1.88 | 13,636.30 | 0.20 | 1,057.84 | |
| Waste Bituminous (PA) | 1753 | 2.28 | 7,544.16 | 0.69 | 1,200.61 | |
| Ratio (Waste Coal / Normal Coal) | 1.21 | 0.55 | 3.50 | 1.13 | 6.3 | |
| Bituminous (WV) | 25409 | 1.54 | 13,151.33 | 0.11 | 1,023.19 | |
| Waste Bituminous (WV) | 457 | 2.60 | 8,358.19 | 0.46 | 324.25 | |
| Ratio (Waste Coal / Normal Coal) | 1.68 | 0.64 | 4.04 | 0.32 | 6.4 | |

