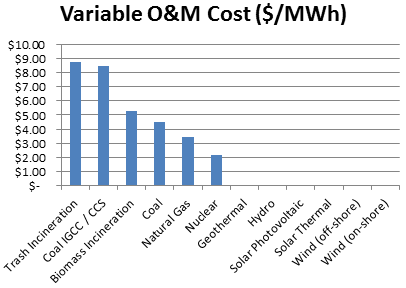
The variable operations and maintenance (O&M) costs are as follows:
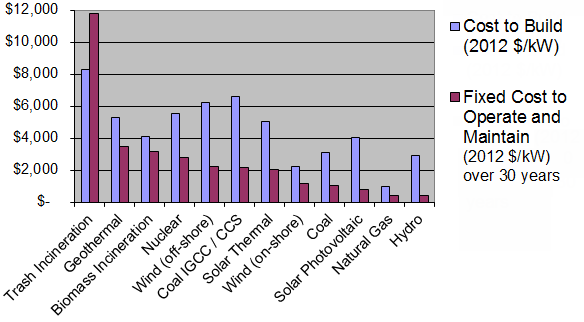
Source: “Updated Capital Cost Estimates for Utility Scale Electricity Generating Plants,” Energy Information Administration, April 2013, p.6, Table 1. Full report here: www.eia.gov/forecasts/capitalcost/pdf/updated_capcost.pdf
See notes below for more context.
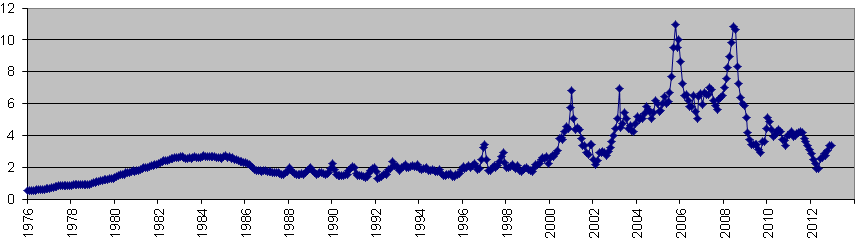
U.S. Crude Oil Price
(Dollars per Barrel)
[through November 2014]
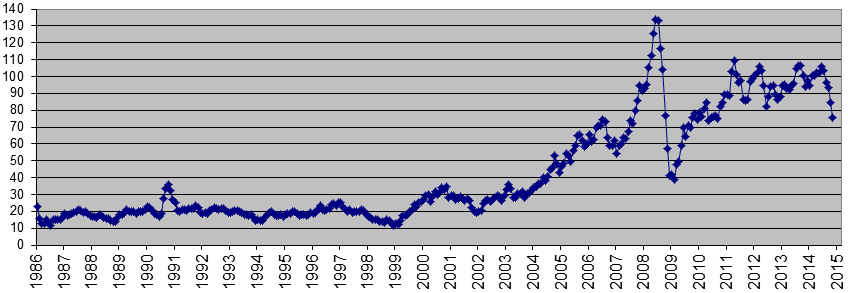
Data from: http://www.eia.doe.gov/dnav/pet/pet_pri_spt_s1_m.htm
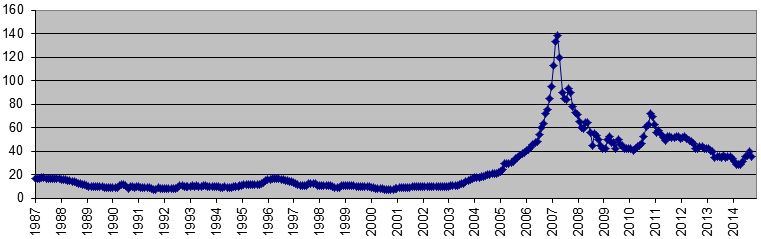
U.S. Natural Gas Wellhead Price
(Dollars per Thousand Cubic Feet)
[through December 2012]
Data from: http://www.eia.doe.gov/dnav/ng/ng_pri_sum_dcu_nus_m.htm
U.S. Coal Prices
[through May 9, 2008]
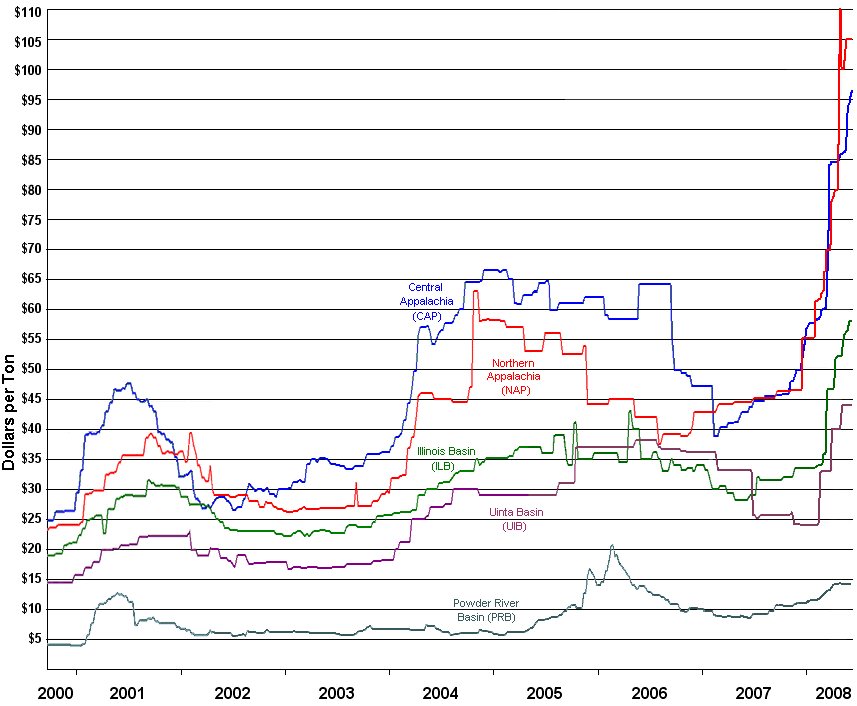
Data from: http://www.eia.doe.gov/cneaf/coal/page/coalnews/coalmar.html
Uranium Prices
(Ux U3O8 Price $/lb)
[through December 2014]
Data through 12/26/2006 from http://www.uxc.com/review/uxc_prices_mth-end.html (The Ux Consulting Company, LLC)
Data since January 2007 from http://www.uraniumminer.net/market_price.htm
Uranium prices are projected to reach $150/lb within a year (see 11/29/2007 article)
Ethanol Prices
[through mid-2007]
Source: CA Energy Commission http://www.energy.ca.gov/gasoline/graphs/ethanol_10-year.html
Based on data from Oxy-Fuel News. Contact Hart Publications and Oxy-Fuel News for data at:
www.worldfuels.com/info.php?OXYF
Variable O&M costs include fuel and other consumable materials and supplies; raw water; waste and wastewater disposal expenses; purchased power (incurred inversely to operating hours), demand charges and related utilities; chemicals, catalysts and gases; ammonia for selective catalytic reduction (SCR), as applicable; and lubricants.
To summarize the EIA table in the top two charts above, we did the following:
- Biomass: used the bubbling fluidized bed type, since combined cycle requires gasification and biomass gasification is highly unusual (most are conventional boilers or fluidized bed)
- Coal: this is an average of single and dual advanced pulverized coal (the traditional sorts of coal plants that can no longer be built in the U.S.)
- Geothermal: took the average of the two types
- Hydroelectric: included only conventional and not pumped hydroelectric (neither of which tends to be proposed)
- Natural Gas: this is an average of conventional and advanced combined cycle (the typical plants built, since combustion turbines and fuel cells are not commonly proposed)
- Solar photovoltaic: this is an average of large and small