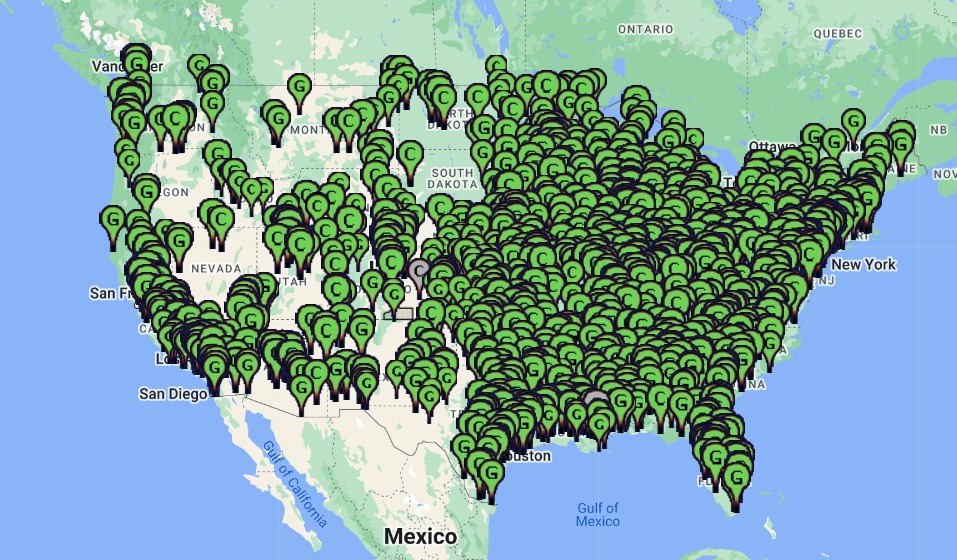
JusticeMap.org (BETA) is an exciting new initiative to map race and income at a very high level of resolution for the entire United States. We’re using data from the 2010 Census (race) and American Community Survey (income) and some software (TileMill) to create a series of map layers. The project is supported by the Sunlight Foundation.
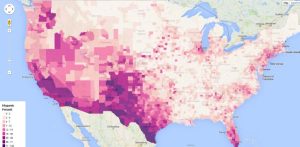
https://www.justicemap.org/(Percent Hispanic, by county)
The project is in early stages. Currently you can view the data. In the future you will be able to access the exact values by clicking on the map. You will also be able to compare who lives within 1 mile (or any other distance) from a point (say a proposed dirty facility) to people who live further away.
We want to empower people who do not have any experience to make maps using race and income. We want to help organizers make visualizations of environmental and economic injustice.
https://www.justicemap.org/index.php?gsLayer=black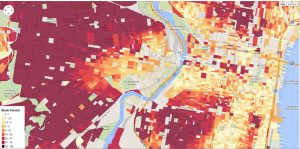
(Percent Black, Philadelphia – zoomed in to block resolution)
You will be able to make a map, share it with friends, export it, host it on your website or ours.